I hope you have built your Kubernetes test cluster using the steps mentioned in the first part Simplest cluster setup for learning Kubernetes.We will now add Dashboard to our cluster which helps us to manage using user interface and have minimal monitoring capacity.
Assuming you already have
- running Kubernetes cluster
- required ports open in security groups or Firewalls.
Lets begin..
Installing the Dashboard
Visit this page to see the latest available version of the Dashboard.
To install it ,run the following command
kubectl apply -f https://raw.githubusercontent.com/kubernetes/dashboard/v2.0.0/aio/deploy/recommended.yamlThis will install the Dashboard with default settings.
Running below command should set you up with Dashboard on localhost at http://localhost:8001/api/v1/namespaces/kubernetes-dashboard/services/https:kubernetes-dashboard:/proxy/
kubectl proxyAs you might you have noticed ,this URL will only work from the cluster.we need expose it to outside using below command.
kubectl proxy --address EC2Ipaddr --accept-hosts '^.*$' --port=8001User Login for testing
Please note that the instructions below would give full access to the cluster with out any authentication so use it only for testing and never on Production.
Enable Skip Login
we can completely bypass authentication you adding flag in the args for easy login.To have that follow steps below
kubectl edit deployment/kubernetes-dashboard --namespace=kubernetes-dashboardIn VI editor add –enable-skip-login as below

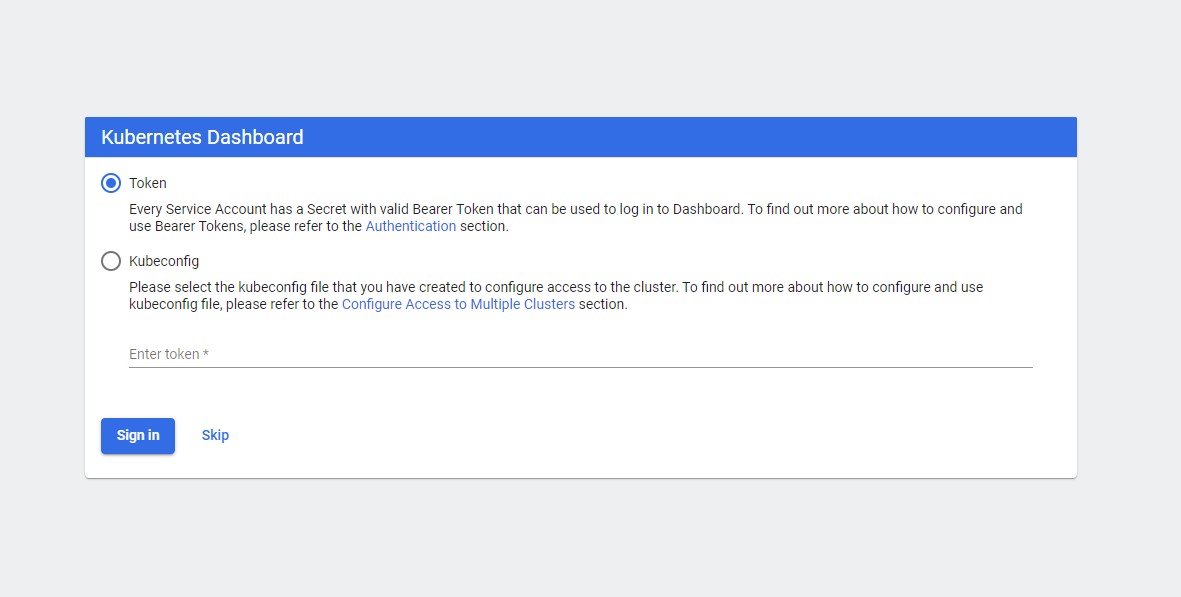
Rerun the proxy command in previous command,you should see skip button as below.

Enable role for the user
Although we could bypass login,We need to give additional permissions for avoiding Forbidden user errors. This post helped me in resolving the issues.
First delete exsiting role for kubernetes-dashboard using
kubectl delete clusterrolebinding kubernetes-dashboard -n kubernetes-dashboardThen create with admin role using this
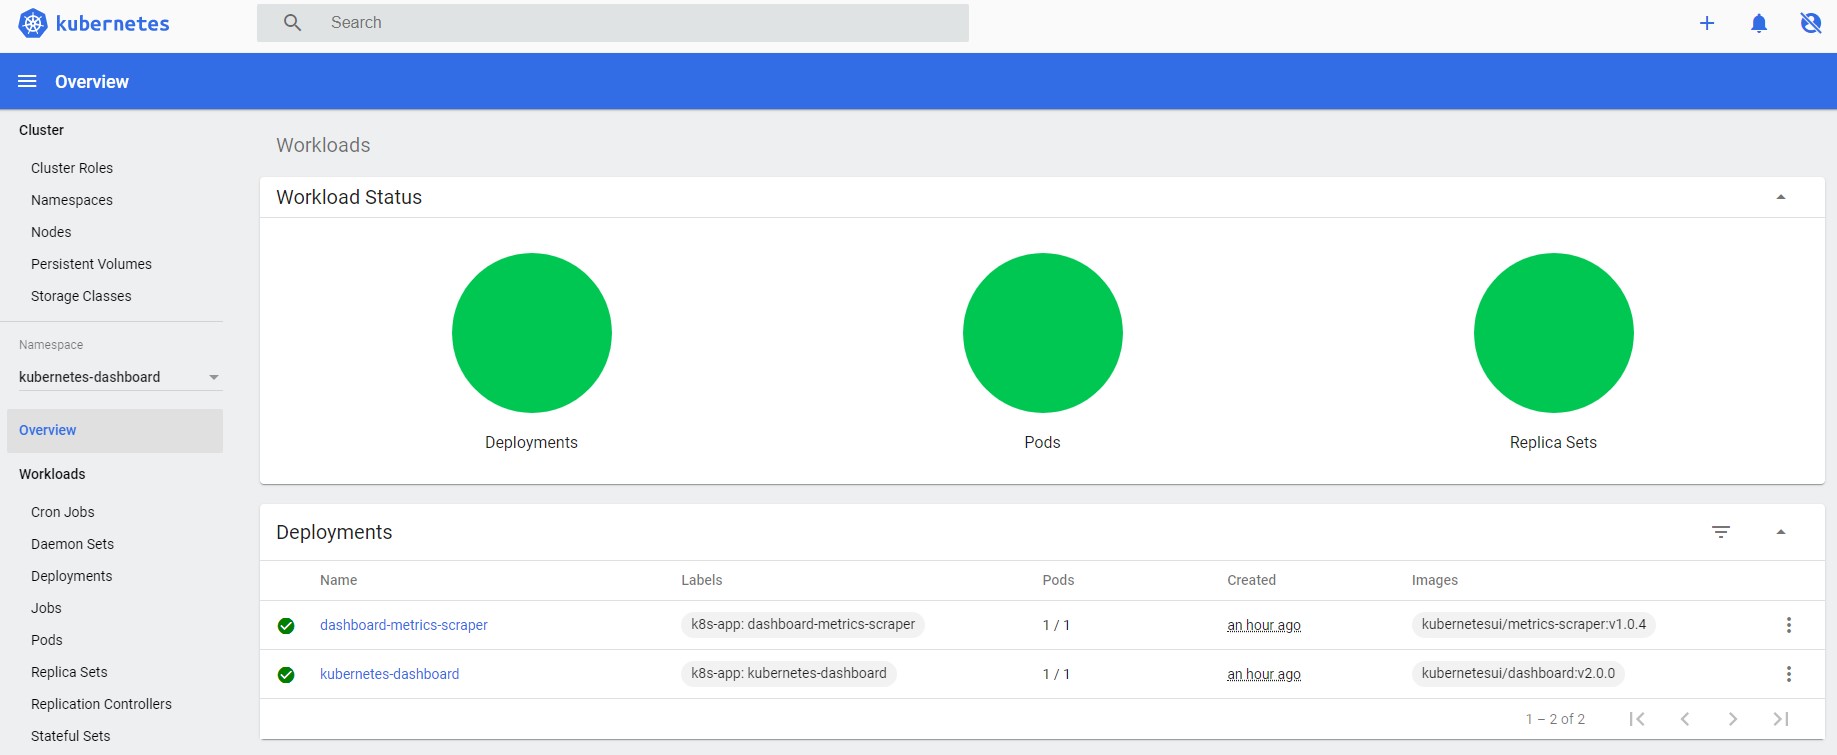
kubectl create clusterrolebinding kubernetes-dashboard -n kubernetes-dashboard --clusterrole=cluster-admin --serviceaccount=kubernetes-dashboard:kubernetes-dashboardRerun the proxy command in previous command,you should be able to login and see all the options
kubectl proxy --address EC2Ipaddr --accept-hosts '^.*$' --port=8001Conclusion
With this setup we should be able see the details of the Nodes,Pods,Clusters,deployments and etc.As your cluster complexity increases Kubernetes Dashboard would be very useful to track the resources.
